Environmental Benefits – Comparison to Conventional Vehicles
- Vehicle Emissions
- Electric vehicles have fewer tailpipe emissions than conventional vehicles. EVs and PHEVs when running in all-electric mode have zero tailpipe emissions. The only emissions in these cases are ones tied to the electricity production. The difference in overall emissions between conventional and electric vehicles depends on the source of electricity that the electric vehicle is using. The chart below shows the national average breakdown of the sources of electricity, as well as the annual emissions per vehicle. This data shows that EV, PHEV, and HEV vehicles all have significantly less annual emissions than that of conventional gas vehicles. Looking for electric cars for sale in san diego? Check out Miramar Car Center to find the right EV for you.
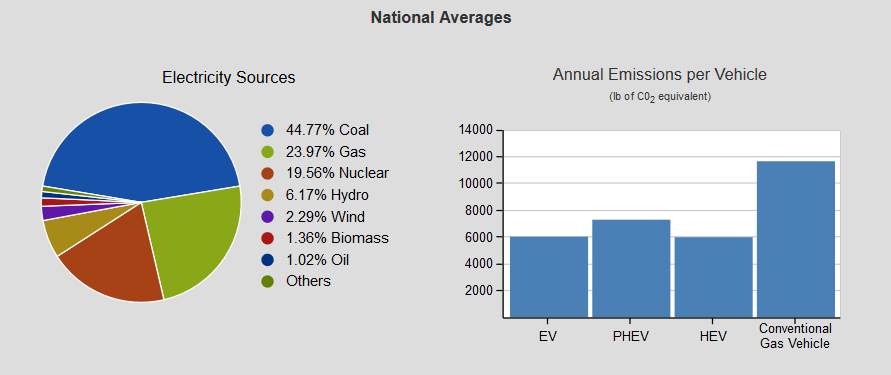
National per vehicle average sources of electricity and annual emissions. (AFDC, USDOE)
- For More Information Click Here.
- Estimate Your Overall Emissions Based on Electricity here.
- Electric vehicles have fewer tailpipe emissions than conventional vehicles. EVs and PHEVs when running in all-electric mode have zero tailpipe emissions. The only emissions in these cases are ones tied to the electricity production. The difference in overall emissions between conventional and electric vehicles depends on the source of electricity that the electric vehicle is using. The chart below shows the national average breakdown of the sources of electricity, as well as the annual emissions per vehicle. This data shows that EV, PHEV, and HEV vehicles all have significantly less annual emissions than that of conventional gas vehicles. Looking for electric cars for sale in san diego? Check out Miramar Car Center to find the right EV for you.
- Fuel Efficiency

- The fuel efficiency in EV’s and PHEV’s is measured in miles per gas equivalent (mpge) and kilowatt hours (kWh) per 100 miles. A light-duty EV or PHEV when driven in electric-mode can travel over 100 mpge and 100 miles per 25-40 kWh.
- To compare the fuel economy of electric vehicles and conventional vehicles, visit http://www.fueleconomy.gov/feg/findacar.shtml.
- This can also be found on:
- Analysis of Overall Environmental Footprint in Kentucky based on Electricity Production Sources
- The annual emissions per electric vehicle in Kentucky is very similar to the national average. While there is about 14% more coal used as an electricity source, with much less gas, the annual emissions per electric vehicle only slightly increases, while PHEV and HEV emissions stay about the same. From the data provided by the Alternative Fuels Data Center, driving an electric vehicle in Kentucky has a smaller environmental footprint than driving a conventional vehicle. Unbeatable deals and a huge selection of used motorcycles await you at ZeCycles. Don’t miss your opportunity to ride away on your dream bike today.
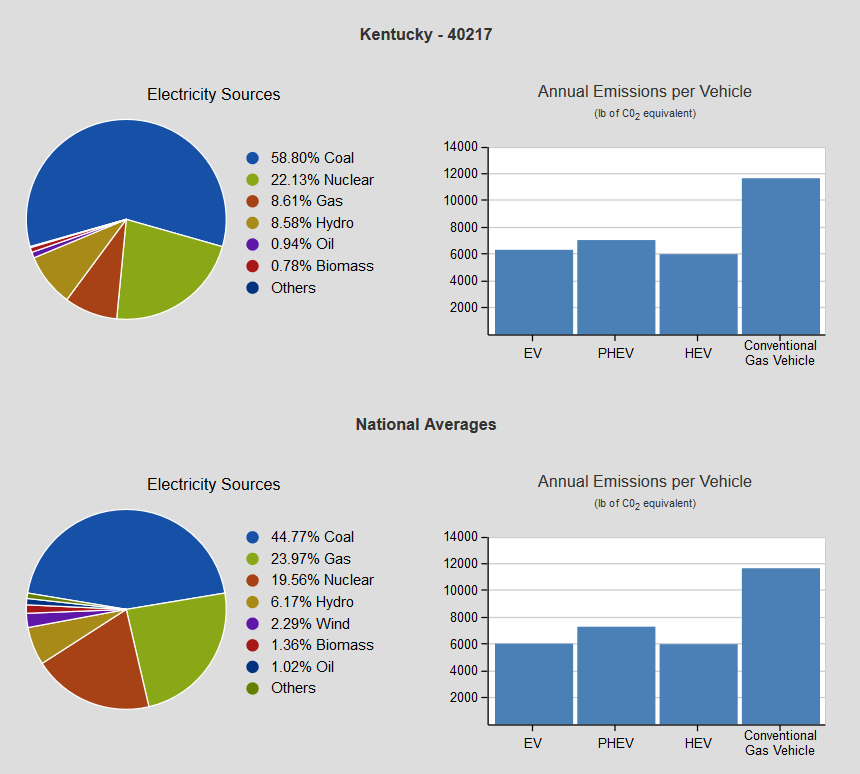
Comparison of Kentucky v. National electricity sources (AFDC, USDOE)
- Cost Comparison
- Cost of Electricity vs. Cost of Petroleum
- On average, fueling a conventional vehicle costs three times the amount that it costs to power an electric vehicle.
- Electricity pricing is much more stable and regional than petroleum.
- Because electricity prices vary state to state, the Department of Energy has put together a tool called eGallon to help consumers determine the cost of driving an electric vehicle in comparison to a conventional vehicle. This tool can be found here.
- Cost of Electricity vs. Cost of Petroleum